Article Learning Expert

How to use spatial transcriptomics to view single plant cells in situ

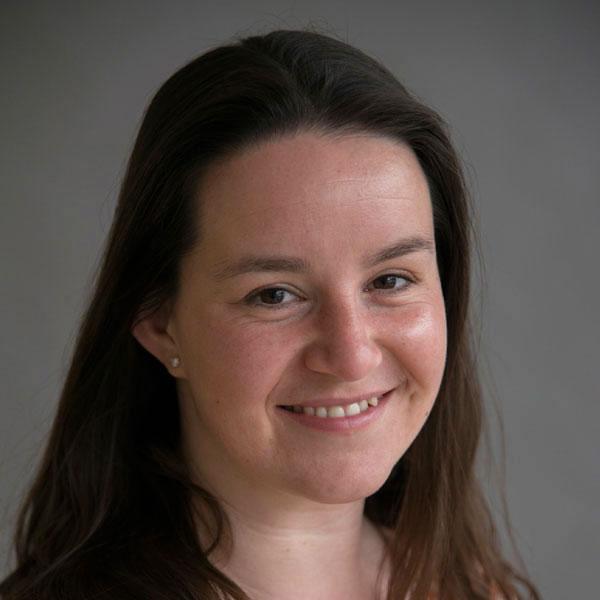
Ashleigh Lister is a Senior Research Assistant in the Macaulay group. She is an expert in the field of plant spatial transcriptomics. In this technical article, she shares her insights, some top tips, and broad approaches to applying spatial transcriptomics in plants.

29 October 2024

This article is part of our technical series, designed to provide the bioscience community with in-depth knowledge and insight from experts working at the Earlham Institute.


Ashleigh is a Senior Research Assistant in the Macaulay Group. She has extensive experience in single-cell and plant biology, with a focus on our spatial transcriptomics platforms. Ashleigh has core responsibility for the preparation of histological samples for downstream spatial transcriptomics experiments.

Ashleigh Lister is a Senior Research Assistant in the Macaulay group. She is an expert in the field of plant spatial transcriptomics, which we first explored in an article in December 2023

Through the piece, conference talks, and training courses, Ashleigh’s innovative work has garnered a huge amount of interest. 

In this technical article, she shares her insights, some top tips, and broad approaches to applying spatial transcriptomics in plants. 

Background

Our group has been conducting single cell sequencing for years on many different species and cell types. It allows us to find out what type of cells they are, or maybe their function or state at that moment in time.

Historically, sequencing single cells requires their original tissue to be dissociated allowing us to isolate them individually. Although we can learn a lot from this type of sequencing, this dissociation and mixing up can have many disadvantages. A big one is that it confuses the overall picture, or story, of what is happening in that tissue, and therefore that organism.

The technique of spatial transcriptomics means the cells are left in situ, undisturbed in their natural positions, alongside their neighbours. 

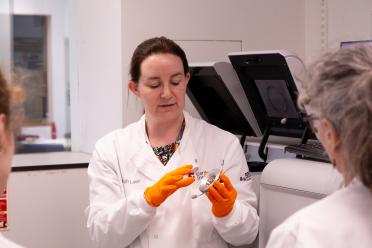
Ashleigh Lister from the Technical Development Group demonstrates the Vizgen platform in a training course

Ashleigh Lister, Senior Research Assistant in the Macaulay Group

There are many platforms to assist automation and standardisation of this type of method. The main divide is between sequencing-based and probe-based techniques.

When it came to making the decision, we went with one that was able to go to single cell resolution or - better - subcellular. This was the highest of our priorities. We required an instrument we could use with non-model samples and which could help us detect rare transcripts.

This led us to the Vizgen Merscope instrument, which uses MERFISH technology - Multiplexed Error-Robust Fluorescence In Situ Hybridisation.

This is an imaging-based platform which hybridises hundreds of customised probes to the genes of interest in your sample. This means the probes bind to the specific RNA fragments you’re looking for within the cells on the microscope slide. 

How does Vizgen MERSCOPE work?

Briefly, the tissue of interest is sectioned and adhered to a microscope slide before the application of probes, which are read out during rounds of fluidics and imaging on the Merscope instrument.

Probes are designed to be complementary to a region within each of your genes of interest. Collections, or probe sets, can be 140, 300, 500, or 960 probes in scale. The genes selected for and targeted depend on the research hypothesis of the user.

For each gene, 30 to 50 cDNA probes are designed across a target region in each of your genes of interest. Each of these probes contain a 20-25nt long hybridising region, and four encoding handles that can bind fluorescence readout probes.

During an instrument run, there are several rounds of hybridisation, which are repeat cycles with different fluids being delivered over the top of the tissue on the microscope slide, coupled with imaging. 

Illustration demonstrating the RNA from gene of interest and the encoding probes

Each round gives the opportunity for different readout probes to hybridise and fluoresce. The handles designated to each probe are used in equal proportions but randomly mixed along the RNA fragment length.

They are attached to different encoding probes along the length of the hybridising region in your gene of interest. They will be read out in different rounds of hybridisation.

In each round of imaging and hybridisation, the pixels will have fluorescent spots that are on or off. This generates a digital barcode of 1s and 0s at each pixel. The combination of 1s and 0s is unique to one of the sets of probes and is decoded to find the gene of interest.

This digital sequence is overlaid onto the fluorescent microscope images. The final image will show the cells, with different colour-coded spots inside. This is how we’re able to identify which genes are in which location in the space (spatial transcriptomics).

We’re able to tell which transcripts are found in which cells, how many of each are found, and even where they are expressing in each cell. We can also tell which cells express these transcripts, what their neighbouring cells are doing, and start to deduce whether they might be communicating or working together in a functional network. 

The Vizgen MERSCOPE equipment

The instrument comprises three ‘boxes’. The first is a controller housing a computer required for the software that drives each stage of imaging and fluidics control as well as writing the raw data. It also initiates the lasers, which are fed via optical cables into the main box.

The main box has two compartments on the surface. One side seats the flow chamber, designed to hold the tissue section, on the slide, over the top of the microscope objectives. It is also connected to the gene imaging cartridge which is seated next to it on the other side of the main box. Imaging buffers are pumped through the flow chamber

Finally, the instrument requires a powerful linux-based analysis computer.

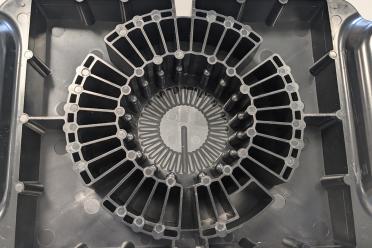
For each slide run on the instrument, a gene imaging cartridge is loaded to deliver specific fluids depending on the stage of hybridisation. The picture shows the different compartments which all contain different fluids, such as the readout probes. 

Illustration of the protocol in the lab, from organism growth, to harvest and dissection, fixation, embedding, sectioning and finally tissue adherence.

Demonstration of the lab protocol

Fixation and sectioning

The samples we work with using the Merscope platform are fresh frozen, fixed frozen, or Formalin-Fixed Paraffin-Embedded (FFPE).

Fixation is sometimes used in order to hold a sample's morphology intact. Occasionally, some of the cell layers will come away, and the sample no longer reflects which cells are situated next to each other in vivo.

Depending on this workflow, the tissue is dissected (and maybe fixed) and then embedded into a resin. The resin has the job of holding the dissected tissue in a firm structure so we’re able to cut through it without the tissue shifting or avoiding the blade.

For fixed or fresh tissue, sectioning is performed using an instrument called a cryostat. This has a temperature controlled chamber and sample holder. The temperature is specific to the tissue you will section, according to cell composition and morphology of each sample. This can require a lot of optimisation. 

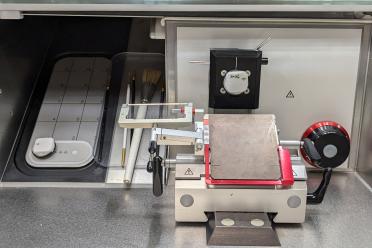
Tissue block set up in the cryostat

A tissue block set up in the cryostat.

The tissue, embedded in its resin block, is mounted into a head position which moves up and down, bringing it closer to the blade by 10um each time. The blade speed is controlled by the user and cuts through the tissue and resin, to peel off a 10μm “thick” layer. Care is needed - the section has a tendency to roll back onto itself or to tear.

A microscope slide is laid onto the section. Due to the warmer temperature of the glass, the section melts onto the slide, in part due to the resin which is clear and fluid at room temperature. Cryosectioning is more like an artistic skill. In one of the recent projects I was working with, a highly talented PhD student Katie Long (John Innes Centre), fixed, embedded and sectioned 36 wheat spikes in a block. Sectioning is a skill that I am developing as part of another project where we are attempting to use Arabidopsis leaves.

The slide is dried out and fixed using paraformaldehyde. This is vital for a few reasons;

  1. it prevents any further transcription occurring, 
  2. it prevents movement of the sample which can cause a blurred image, and
  3. it maintains the morphology of the tissue structures which is important because require a highly resolved (non-blurry) image as the end goal.

The next stage is permeabilisation. This uses ethanol to punch holes in the cell membrane, vital in allowing the all-important hybridisation probes to gain access.

Slide preparation

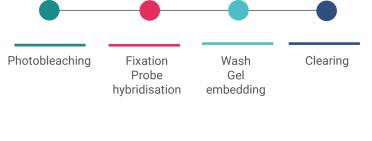
Illustration of the slide prep, from photobleaching, to fixation on the probe hybridisation, wash gel embedding and finally clearing.

Stages of the slide preparation for Vizgen MERSCOPE

While the slide is in its petri dish, I test the natural levels of autofluorescence in the tissue section.

Autofluorescence in the samples will show up in the same wavelength channel as one of the essential stains, so it’s good to reduce or eliminate this. If they are high, I place the slides into an instrument called a photobleacher, which deliberately overexposes the slides to UV light. This dulls the autofluorescence in the blue wavelength specifically.

For the plant tissue I work with, this process can take up to 8 hours. I check before and after, as a rough measure if it has worked, and how well.

The ethanol is removed and rinsed off. There is then a quick wash using formamide which relaxes the RNA fragments (straightens them out) which promotes accessibility for the next stage of the protocol. The probes, which are in a small volume of solution, are carefully aspirated onto the surface of the tissue.

We allow the hybridisation to occur over a period of 48 hours in an incubator. Careful monitoring of the temperature and systems to prevent evaporation of the probes is necessary during this time. The whole group actually get text message alerts if the temperature drops or climbs too high! We have to be extra careful as this is a really expensive part of the protocol, the probe set is a big financial investment.

The next day of protocols is full-on. We start by washing the probes off. We wash using formamide, which is another fixative - this one targets RNA molecules, rather than the more general tissue and cell morphology. In this case, the formamide is used as a rinse to prevent non-specific binding, or off-target fluorescence, being detected.

The next stage is tricky, really tricky. Everyone in our group that has to do this method, really does not enjoy it! It’s called gel embedding.

We have to cover the tissue section with a polyacrylamide gel. This is done to give the tissue a supportive structure and it prevents damage during the next stages. It also does the really important job of binding to one end of the transcripts - literally holding on to the poly-A tail of an mRNA transcript - and fixes their spatial locations in the gel.

For us, in the lab, this means aspirating  the gel, applying a treated glass coverslip, applying just-the-right pressure with a set of tweezers to the coverslip, and - with the other hand - removing excess gel from the outside.

For a good image, the gel should be thin. But, if it is too thin, the tissue structure will fall apart and can actually float off the slide. And you need to do this with a steady hand. And the gel mix sometimes doesn’t set due to a few factors. And you can apply too much pressure so that you damage the tissue. The gel, being liquid, causes the coverslip to float, and shift which makes it difficult to control.

And, because we are panicking about this - ironically, it gives you a shaky hand. Did I mention I don’t enjoy this stage?

The final stage is to set off the clearing process. Clearing is where the tissue’s proteins are digested away using SDS and proteinase K enzyme. This stage takes different amounts of time or requires different temperatures, depending on the tissue.

Run day

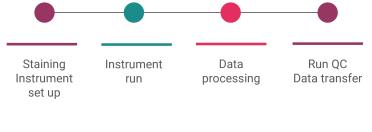
Illustration of the 'run day' workflow, from staining instrument set up, to instrument run, data processing, and finally QC data transfer.

Protocol for the run day

There is a run cartridge that contains large volumes of liquid solutions. This needs to be defrosted an hour before the run. I set this going as soon as possible. 

Inside the instrument shows the different compartments which all contain different fluids such as the readout probes.

A gene imaging cartridge with different compartments which all contain different fluids such as the readout probes. 

I clear the computer drives of previous runs to ensure we have enough free space to create new raw files. I then clean everything, first with ethanol, then RNAse ZAP spray. I also give the stage on the instrument and microscope a clean.

The instrument requires a wash cycle. This is a good chance for the communications to be tested, and the fluidics too. We run nuclease-free water through to ensure that there are no enzymes in the system that will destroy the RNA or probes during the run.

I check the levels of autofluorescence are acceptable. At this stage, I can top them up before I run the samples.

The sample itself is rinsed to stop further digestion. The tissue is stained (different to the probes). The stains are DAPI (which indicates DNA regions in the nuclei of the cells) and poly T (which marks the areas where genes are found).

These are required later on for a processing stage called cell segmentation, when boundaries for individual cells are defined. The stain and the probes are then fixed with more formamide, rinsed, and then the run can be set up.

The slide is fitted into an adapter called the flow chamber. This is a metallic jacket that holds the slide in alignment over the microscope objectives. The other job it does is to create a space that can be filled with fluids. Aqueducts (tubes) deliver various fluids into the flow chamber, from the gene imaging cartridge.

The gene imaging cartridges deliver readout probes - oligos that will hybridise to the handles on the hybridisation probe. There are three that are read out in each round of hybridisation - the number of rounds is different depending on the number of genes you are targeting from your probe panel.

The cartridge also delivers wash fluids to be able to quench (turn off) fluorescence and rinse between readout probe cycles, and also to ensure that the tissue remains wet at all times. 

Once the slide is in the flow chamber, seated onto the microscope stage, and the fluidics lines attached, we can trigger the run.

There is an image taken at 10X and the software will show what the DAPI staining looks like at this resolution, as an overview. From this we are able to draw around regions of interest. These are the areas we have told the software to concentrate its imaging efforts on.

Bigger regions mean longer runs and more data, but this is all dependent on the tissue or the research focus. 

We can then trigger the 60X imaging. This requires an oil application on the objective. No bubbles must be present. This is the final stage - I can trigger the run, which will take around 12-18 hours to complete. Once the imaging completes, I can set off the processing.

It takes half a day to move the large amount of data (8Tb) to a linux processing computer. The processor stitches all of the z stacks (layers of microscopy images at different thickness depths) at the different locations to make a mosaic as a zipped file.

If we were to run mammalian samples, it’s possible to perform a staining for cell boundaries. If this has been done, the analysis is able to run a python script to segment the cells for you. Plant tissues do not have this luxury and therefore require an off instrument solution, which runs in a similar way.

As a lab technician, my job in the lab is essentially done. All that is left to do is to clean the instrument, and send the data to the HPC using a python script.

Back in the office, I use software called Vizualiser - a Vizgen-specific image visualisation tool - to look at all of the data as an image. This is the point I know how well it has gone.

I’ll explore all areas of the slide to check the performance of the run. I’m looking for evenness of the staining (the DAPI and polyT), the morphology of the sample (how intacts the tissue is), and the number of spots there are.

Depending on the performance of the run, I will often need to start an email trail, looping in the collaborators to look into troubleshooting with the Field Application Specialist, or their technical support team at Vizgen. They might suggest improvements I could try, or tests I might need to run. This can be put into place for next time.

A batch of slide preparation takes a full week. If this is a big-scale experiment, slides are prepared for running in pairs. One slide is run on Friday, and the other waits until Monday.

Therefore, it might be that once a run finishes on Monday I will set off the prep for the next batches by doing probe hybridisation and in the afternoon set off the run that is waiting. 

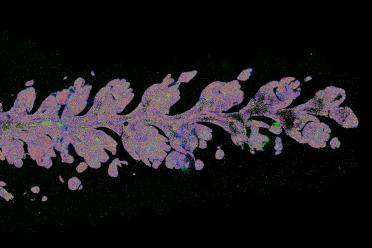
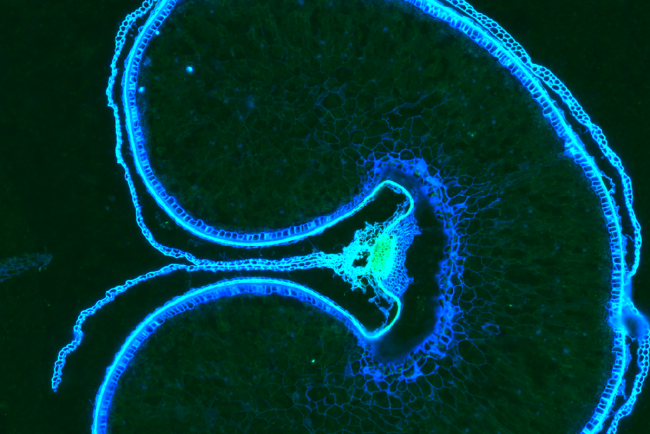
Spatial image of a wheat spikelet

In conclusion, spatial transcriptomics has been a huge learning curve for me. In my career so far, I have not been involved in any technologies that use histology, imaging, and this much data handling. It has been difficult and really interesting to learn all of these new methods.

It's incredibly satisfying when it works well as it makes all of the learning and challenges worthwhile. And this is directly contributing to two strategic research programmes at the Institute - Cellular Genomics and Delivering Sustainable Wheat.

I am really lucky in our team that I am not on my own in this new spatial world. I work with another couple of people in the group who are doing this too, on mouse samples - Dr Sonia Fonseca and now Vanda Knitlhoffer. It is lovely to be able to share tips and tricks and troubleshoot together. Another key person in this new world is Dr Carole Chedid, our Vizgen Field Application Specialist, who is an incredible teacher and always happy to help.

In brief:

  • Before you start, it’s really important to understand the whole process so you can properly configure things for your tissue of interest
  • Getting great images will usually require many stages of optimisation, but is absolutely worth it for the outcome
  • It can be daunting but the insights generated are allowing our researchers and collaborators to answer brand new questions

You can access the Earlham Institute’s single-cell and spatial platforms and expertise as a collaboration or service by contacting the team directly or through the Technical Genomics team as part of the Institute’s Transformative Genomics National Bioscience Research Infrastructure (NBRI)

The instrument was purchased via a BBSRC capital equipment grant and is maintained by NBRI funding. The instrument is utilised for both research and service projects. 

We hope to have a webpage soon, which will share Vizgen platform information and everything you might need to know in order to start a new project with us.


If you have any questions or feedback - whether positive or negative - please email communications@earlham.ac.uk.